Time:2016-07-21
Defense isessential for animals’ survival in nature. Animals facing danger display different aspects of defensive behaviors (e.g. flight, freezing and risk assessment). Previous studies have suggested that the midbrain periaqueductal gray (PAG) participates in the control of defensive behaviors. However, few studies have examined the neurophysiological mechanism of PAG underlying defense.
To explore the exact role of PAG in defensive behaviors, Dr. WANG Zuoren’s lab at the Institute of Neuroscience, Chinese Academy of Sciences, first examined the behavioral effects of optogenetic activation of dorsal PAG in mice. They found that optogenetic activation of neurons in the dorsal PAG was sufficient to induce a series of defensive responses (including running, freezing, and avoidance).
Using chronic extracellular recording, they investigated the endogenous neural dynamics of dorsal PAG in freely behaving mice exposed to natural threats (rats). They observed that there exist distinct neuronal subsets within the PAG participating in respective detection (risk assessment) and response (flight) aspects of defensive behaviors. Further analysis showed that neuronal spikes of risk assessment cells occurred more frequently when mice were near the rat. As to the flight cells, their spiking activities were not correlated with instantaneous movement velocity during flight. These observations provide novel insights for investigating defense from an electrophysiological perspective.
This research entitled “Periaqueductal gray neuronal activities underlie different aspects of defensive behaviors” was published in the Journal of Neuroscience on July 20, 2016. This work was carried out by graduate students DENG Hanfei and XIAO Xiong under the supervision of Dr. WANG Zuoren. This work was supported by the Strategic Priority Research Program (B) of the Chinese Academy of Sciences (grant No. XDB02040000) to Z. W.
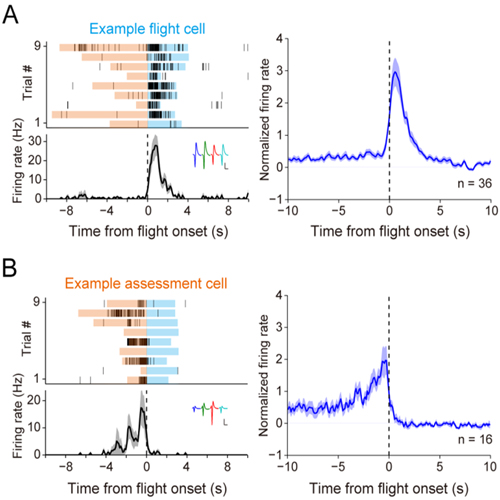
Figure A, Left, Example of a flight cell. Trials were aligned to flight onset. Blue shading, flight episode; orange, risk-assessment episode. Right, Normalized average PETH across all flight cells.
Figure B, Left, Example of a risk-assessment cell. Right, Normalized average PETH across all assessment cells.
 附件下载:
附件下载: